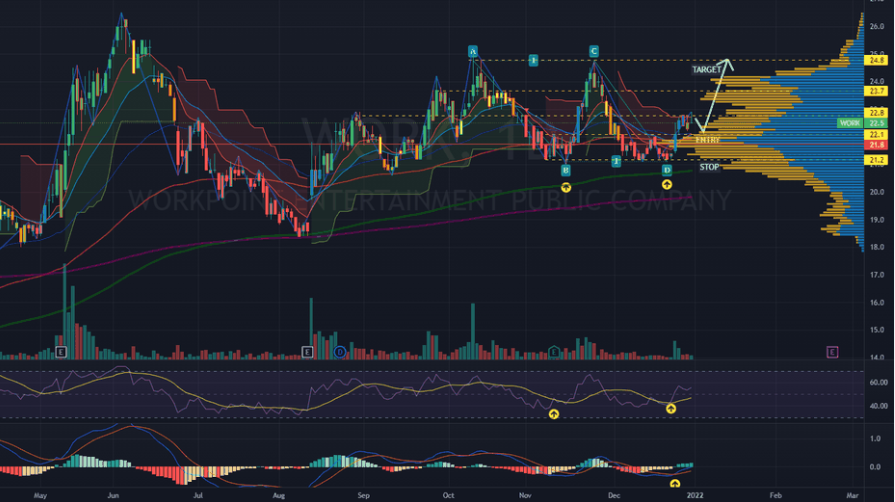
In stock trading, where the ability to make informed investment decisions is paramount, understanding the market’s pulse becomes even more crucial. Traders rely on many tools and techniques to navigate the ever-changing waves of the economy. Among these, technical analysis tools play a predominantly instrumental role.
By delving deep into market trends, stock behaviour, and price patterns, these tools provide invaluable insights that can help forecast future market movements with greater accuracy and confidence. They offer a comprehensive analysis of historical data, identifying trading patterns and trends that could otherwise go unnoticed. This in-depth understanding of market dynamics equips traders with the knowledge to seize opportunities and effectively mitigate risks.
Technical analysis goes beyond just numbers and charts. It incorporates the psychological aspect of trading, considering the collective mindset of market participants. By understanding investor sentiment and market psychology, traders can anticipate potential market shifts and proactively adjust their strategies.
Moving averages
Moving averages are one of the most prevalent technical analysis tools for smoothing out price data to identify trends over a specific period. A moving average is the average cost of a security over a set number of days, constantly updated as new data becomes available. The most common types are simple moving averages (SMA) and exponential moving averages (EMA).
Traders use SMAs to gauge the general direction of market trends, while EMAs give more weightage to recent data points, making them more reactive to price changes. By plotting SMAs and EMAs on a chart, traders can identify trend reversals or potential entry/exit points for trades.
For example, if you trade in US stocks, you may follow the 20-day and 50-day SMAs to understand the price momentum over short-term and long-term periods. A crossover between these two SMAs could indicate a potential shift in trend direction.
Bollinger Bands
Developed by John Bollinger, this powerful tool utilises statistical analysis to measure volatility and identify overbought or oversold conditions in the market. Bollinger Bands consist of three lines representing standard deviations from the SMA. These bands dynamically adjust to market conditions, widening when volatility is high and narrowing when it is low.
Traders rely on Bollinger Bands to understand potential price breakouts or reversals. When prices touch or move beyond the bands, it may signal a trading, buying or selling opportunity, providing traders with valuable information to make informed decisions. With its ability to capture market dynamics and offer actionable signals, Bollinger Bands are a popular tool among traders in Singapore seeking to navigate the complexities of the financial markets.
Relative Strength Index (RSI)
The RSI is another technical analysis tool used to measure the magnitude of price fluctuations and identify o日本藤素 verbought or oversold conditions. This indicator compares a security’s average gains and losses over a certain period.
Traders in Singapore often use the RSI to identify potential trend reversals or confirm existing trends. For instance, if stock prices have been consistently rising, but the RSI shows a declining trend, it may signal a potential correction or reversal in the stock’s price. By incorporating RSI into their analysis, traders can make informed trade and investment decisions based on market sentiment and avoid being swayed by short-term volatility.
Fibonacci Retracement
Based on the famous Fibonacci sequence, this tool helps identify possible support and resistance levels in stock prices. Traders use this technique to plot lines at specific ratios (23.6%, 38.2%, 50%, 61.8%, and 100%) on a price chart, representing potential levels where the stock’s price may reverse direction.
Fibonacci retracement helps identify buying or selling opportunities at critical levels, as these levels often act as strong support or resistance areas. Traders also use this tool to measure the extent of a price correction and potential target levels for profit-taking.
What are the possible drawbacks of using technical analysis?
While technical analysis tools offer valuable insights and can improve decision-making, it’s important to acknowledge their limitations. One of the main criticisms is that these tools solely rely on historical data, which may only sometimes capture other significant market factors, such as news events or company announcements. Consequently, depending on these indicators alone can sometimes lead to false signals and poor trade decisions.
It’s worth noting that technical analysis can be subjective. Traders in Singapore may interpret the same data differently, leading to conflicting signals and varying trading strategies. This subjectivity further adds complexity to the process, making it challenging to create a definitive trading strategy solely based on technical analysis.
Considering these factors, it is evident that while technical analysis can be a valuable trading tool, it should be complemented with a broader understanding of the market and other relevant factors to make well-informed trading decisions.
Final thoughts
Technical analysis tools are crucial in identifying market trends, potential entry/exit points, and risk management strategies. However, only some tools can guarantee success in stock trading. Traders must understand the limitations of these tools and use them in conjunction with other techniques while staying updated on market news and events.
It is essential to backtest these tools on historical data and continuously monitor their effectiveness in the current market conditions. With proper knowledge and practice, technical analysis tools can aid traders in making better decisions that can potentially lead to lucrative trades.


